This website is all about managing climate change risks, and a big part of that it understanding the nature of the existential risks society is taking in the first place. That's why we are privileged to have been given permission to publish the following white paper as an article below:
How our (in)actions in dealing with CO2 emissions may result in chaos
By William Strauss, PhD, June 26, 2020, FutureMetrics
“Linearity is a trap. The behavior of linear equations… is far from typical. But if you decide that only linear equations are worth thinking about, self-censorship sets in. Your textbooks fill with triumphs of linear analysis, its failure buried so deep that the graves go unmarked and the existence of the graves goes unremarked. As the 18th century believed in a clockwork world, so did the 20th in a linear one.” Ian Steward, Does God Play Dice? The Mathematics of Chaos, 1989.
While the covid-19 pandemic and the severe impact it is having on societal and economic conditions continues, the fundamentals that contribute to climate change remain in force. The pandemic is clear and present and, for many jurisdictions, has elicited aggressive, organized, and coordinated policies. To many, the slow-motion characteristics and the complex dynamics of human induced climate change are not so clear and present. Crafting and implementing an aggressive strategy to change what has been business as usual for more than a century, dependence on fossil fuels, is proving to be extremely challenging.
Inaction on dealing with climate change could be compared to the counterfactual of inaction in the face of a global pandemic. With respect to climate change, how can policymakers do nothing when faced with the potential for such dire outcomes?
Perhaps it is the uncertainty of just how bad the consequences will be. Perhaps it is the shortcomings of some political systems for dealing with long-term existential threats. Perhaps business as usual is expected to remain the best option for economic and social well-being. For the fast-motion of a disease pandemic, most of those blockages have been dispelled in short order. For the slow-motion climate crises, it is not the same.
This short white paper is not about proving what the consequences of climate change are. It is about showing that the consequences of business as usual and policy shortcomings can be dire and can have the potential to cause increasing and accelerating negative effects on economic and social stability (covid-19 is illustrating some of this in real time).
This white paper is a discussion about how rapid change to conditions within a dynamic system lead to increased uncertainty and decreased security. Specifically, the paper discusses how the rapid increase in CO2 emissions, if unabated, will likely change the future in dramatic ways.
The goal of this call to action paper is to avoid the potential for chaos.
Chaos – Natura on facit saltum – “Nature does not willingly make a jump”[1]
Just like Covid-19 will continue to increase in scale if nothing is done, the effects of the rapid rise in CO2 concentrations in the atmosphere will also increase. Along with the well-known global warming impact, this will result in a decline in the predictability of future conditions and a higher frequency of disruptive events. As in all dynamic systems, and in particular in the complex, non-linear, and highly interconnected biosphere/hydrosphere/geosphere/atmosphere, feedback loops amplify effects. Furthermore, as a dynamic system is continuously and increasingly perturbed by changing external forces, the time it takes for cause and effect to occur can decrease. As dynamic systems undergo rapid evolution, chaotic[2] outcomes are more likely.
The graph below shows a model of a process that starts out with a predicable path[3]. The system is deigned with a simple feedback loop so that value in the next period is based on the value in the current period of the process. In the early time periods, the path is predictable. The future is what it is supposed to be. But as the system is exposed to increasing external influence, the path bifurcates, and the variability of the outcomes increases. Eventually there is no way to predict the future as all possibilities between zero and one are possible at the same time. Also, once the system reaches a critical point, the changes happen with increasing rapidity. The change from “normal” to chaos happens somewhat suddenly with relatively small increases in the forcing parameter.
A Process Moving into a Chaotic State
The example above llustrates the fragility of equilibrium in some dynamic systems to sudden, persistent, and increasing changes.
Does this simple model provide insight into climate and CO2? Clearly, modeling climate requires very complex models and very powerful computers. But the inherent structural dynamics and feedback loops of planetary climate equilibrium means that the system can be destabilized by rapid, persistent, and increasing change similar to that which drives the simple model above. For climate, the forcing parameter we can do something about is the sudden, persistent, and increasing amount of CO2 concentrations in the atmosphere caused by the use of fossil fuels for energy.
There is no questioning the valuable role that fossil fuels have played in the evolution of civilization in the last few centuries. But there is also no question that if we keep doing what we are doing we are on the pathway to chaos (chaos by all definitions – mathematical, ecological, economic, and social). The massive, sudden, and increasing rate of release of CO2 if not controlled and abated, will result in increasingly unpredictable and extreme weather (the impact on ocean temperature and acidity is a serious comorbidity that is not a part of this paper). Nature’s complex processes, inherent in the complex systems that have allowed us to live and thrive on this planet in relative equilibrium for a very long time, do not like to jump.
Forcing Chaos – Human actions enable the alpha parameter to increase!
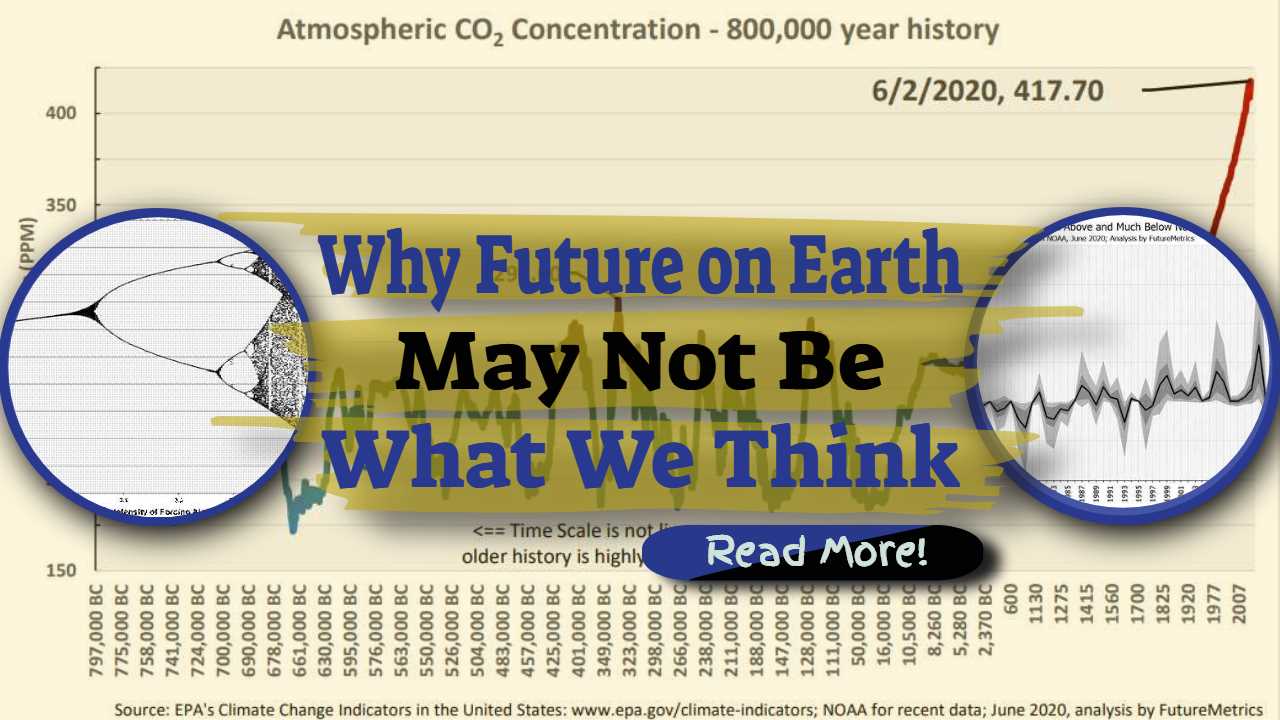
The chart below shows atmospheric CO2 concentrations over the past 800,000 years. In recent times, new highs have been hit almost every year. The most recent record was this month (June 2020). This data fits the description of a sudden, persistent, and increasing influence.
There are many weather variables that are impacted by increasing CO2 levels. It is commonplace these days to see maps of temperature anomalies showing unprecedented new extremes, lists of extreme weather events showing increasing frequency and impact, data on declining sea ice and shrinking glaciers, and reports of rising sea levels causing increased frequency and severity of coastal flooding. The discussion that follows looks one layer below these symptoms.
To highlight how the forcing effects of increasing CO2 concentrations can relate to the insights about chaos from the complex systems model discussed above, FutureMetrics has used data on US temperature extremes to define PERT distributions[4] for each year’s data. This allows the generation of non-discrete data based on real parameters. The series of probability distributions are sampled thousands of times to generate statistics for each year[5]. The results highlight changes in variability and intensity. The charts below show two views of the results.
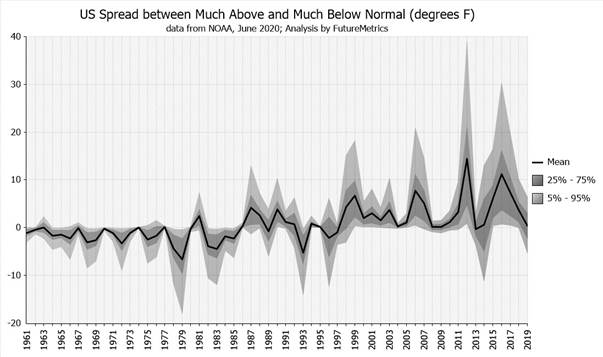
The first chart (above) shows the difference between the annual percentage of observations that are much above normal and much below normal[6]. A symptom of the progression toward mathematical chaos is increasing volatility. The increasing size of the confidence bands in the chart reflects increasing variance. Note that the increasing variance is on the hot side of the neutral value of zero.
The second chart (below) focuses on variance. It shows the standard deviations from each of the sampled years.
The chart shows that the US is experiencing increasing variability in temperature extremes at an increasing rate. Again, as the first chart above shows, recent years are likely to have more higher-than-normal than lower-than-normal observations; a warming trend but with larger spreads between extremes.
The more extreme and less predictable weather will not stabilize or recede if CO2 concentrations continue to increase.
One analysis of one country on one set of weather data does not make a case for global climate change or for proving the consequences of climate change. However, this metric is not comforting when considering how a dynamic nonlinear system responds to persistently changing external forcing elements.
It is likely that if the trends in CO2 concentration caused by fossil fuel use continue as they have, then we are on the pathway to a chaotic response by the earth systems that have provided the stability that has allowed humankind and civilization to exist and evolve.
Focusing on the Critical Forcing Element: Carbon dioxide
Stabilizing CO2 emissions, then reducing CO2 emissions is necessary to lower the likelihood of the earth systems continuing on a path to climate related catastrophic consequences. That atmospheric CO2 levels and climate change are cause and effect is well known and accepted by most nations. Most nations have united in agreeing that reducing CO2 emissions is critical. But to date, in aggregate, the world has continued business as usual.
Greenhouse gas impact is measured as radiative forcing. It is a measure of how many watts per square meter of solar energy are not radiated back into space. Increasing radiative forcing indicates a net increase of solar energy staying on the planet.
As the chart shows, there has been a steady increase in CO2 radiative forcing. That mirrors the earlier chart showing a steady increase in atmospheric CO2 concentration. It appears that business as usual has continued. Indeed, covid-19 has depressed global economic activity and as a result fewer tonnes of CO2 are being emitted. But that is a short-term shock that will pass. Absent serious and aggressive action across the world, the upward CO2 trajectory is unlikely to change soon.
There may be ways to continue business as usual with fossil fuels and avoid climate chaos. Certainty that must be in the minds of some who either deny there is a need for action or delay action. But the science strongly suggests otherwise.
The stability of the systems that support life on earth as we know it is threatened. Along the way as weather changes radically, social systems will be stressed. When and how chaos happens is uncertain. But we should not wait to find out.
Conclusion
Linear thinking leads to a vision of the future: it is what we expect it to be because the future is predictable. But as this short paper has suggested, the complex terrestrial systems that interact to produce weather in the short term and climate in the longer term become less predictable and more extreme the more they are pushed.
As FutureMetrics has noted in other white papers, we need a pragmatic plan that provides a glide path to a decarbonized future. A plan is good (and even that is missing in some major emitters), but committed, aggressive, and meaningful action to get carbon out of transportation, heating, and power generation starting now is necessary.
[1] From the title page of “Principles of Economics”, Alfred Marshall,1890-1920, eight volumes.
[2] This reference is in the mathematical sense. See https://en.wikipedia.org/wiki/Chaos_theory
[3] Based on a simple discrete forward difference equation that generates a basic time series: 𝑥𝑥𝑡𝑡+1 =𝛼𝛼𝑥𝑥𝑡𝑡(1−𝑥𝑥𝑡𝑡) where alpha is the forcing parameter.
[4] https://en.wikipedia.org/wiki/PERT_distribution
[5] FutureMetrics uses software from Palisade for simulation modeling. https://www.palisade.com/
[6] “In each case, we define much above (below) normal or extreme conditions as those falling in the upper (lower) tenth percentile of the local period of record.” From NOAA https://www.ncdc.noaa.gov/extremes/cei/definition

Energy Security Without Fossil Fuel Lock-In: Why Sustainable Bioenergy Still Matters
In times of geopolitical tension and energy market instability, governments are often tempted by what look like simple answers. More domestic fossil fuel production. More natural gas infrastructure. More emphasis on short-term supply over long-term transition. At first glance, those responses can sound practical. They promise reliability, affordability, and control. But in reality, they risk […]

A Success Story: LFG-to-Energy Conversion Units Transforming Landfill Gas in California
California's landfill gas-to-energy conversion units are redefining waste management by transforming captured methane into electricity, renewable natural gas for vehicles, and liquefied natural gas. These advancements mark a significant step towards sustainability, reducing carbon footprints and turning waste into a valuable, clean energy resource…

Is Natural Gas Sustainable? Explore the Facts
Discover the truth about the sustainability of natural gas on our blog.
Methane Capture Systems: The Cure For Global Oil Addiction?
The world runs on oil, but this dependency creates serious problems. Air gets polluted, water sources get contaminated, and the climate crisis worsens. People are looking for better ways to reduce harm caused by our “oil addiction.” Methane capture systems might be a solution. These systems trap harmful gas released during oil and gas production. […]